Author: zaf3r

zaf3r
December 8, 2020
Breast Cancer Detection Using Thermal Infrared Images
December 8, 2020

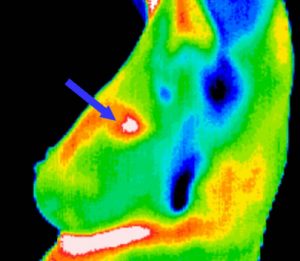
Today, one of the most common cancers identified in women is breast cancer. Several standard screening techniques are used for early detection of breast cancer such as Mammography and Thermography. Thermographies are thermal infrared images that are used to detect lesions in breasts. These Thermographies detect the temperature of the different regions of the breast. Regions with warmer temperature are more likely to contain tumors than normal tissue. A dynamic Thermography procedure is used to detect the difference between normal and abnormal tissues. This procedure uses thermal infrared cameras to generate infrared images at fixed time which contains a sequence of infrared images. The dynamic Thermography technique has several advantages:

  • It is less expensive than the mammography and magnetic resonance imaging (MRI)
  • It is non-invasive, non-ionizing
  • It is a safe diagnostic procedure, in which patients feel no pain

The discipline of the work of dynamic Thermography is based on two facts:

  • the temperatures of breast cancer regions are warmer than the surrounding tissues, and (2) metabolic heat and blood per-fusion rates generation in tumors are much higher than the rates of normal regions.

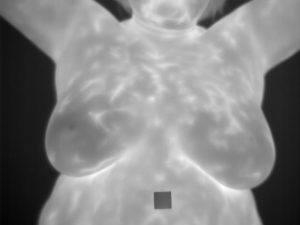
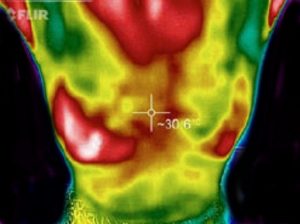
While using dynamic Thermography method, the variation of temperature between healthy and unhealthy breasts can be recorded by thermal infrared cameras. Using this method may increase the detection findings of static infrared images by exploiting cooling or heating procedures as a superficial stimulus to improve the thermal contrast and thermally exciting tissues of patients’ breasts. It is important to highlight that since the temperature range of body is 36.5∘C to 37.5∘C and higher temperature range may harm the living tissues in the breasts, hence the cooling procedure is much safer than the heating procedure. This cooling procedure proceeds as follows:

  • After applying the cooling procedure on the breasts, the temperature of healthy tissues decreases with an attenuation of vascular diameter
  • In turn, the temperature of abnormal tissues remains unaltered (or it increases with a vascular dilation)
  • The findings of the analysis of the similarity (or the dissimilarity) between infrared images acquired before and after the cooling procedure can be exploited to reveal breast cancer.
 

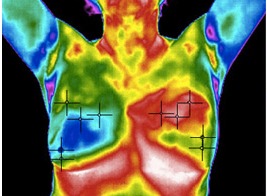
Since 1990s, respective techniques have been presented for the early detection of breast cancer, such as mammography and MRI. Both techniques have their own drawbacks. Mammography is the standard method for early detection of breast cancer, but its main drawback is that it may produce a large number of false positives. In spite of mammography, the MRI technique is added to mammography technique for women with genetic mutations. However, its main limitation is that it has a limited spatial resolution, yielding a low sensitivity for sub-centimeter lesions. Several other techniques have been suggested to overcome the limitations of aforementioned methods (Mammography and MRI). The infrared thermal imaging method can analyze breast cancer using dynamic Thermograms and also it can selectively optimize the contrast in areas of dense tissues in young women. By taking into account the lateral views and the frontal views of the breasts, scientists proposed a new method for extracting the region of interest (ROI) from breast Thermograms. The obtained ROIs help physicians to differentiate between the bio-markers of normal and abnormal cases. Saniei et al. [27] presented a five-step approach for analyzing the thermal images for cancer detection. The five steps are listed in the following paragraph:

  • The breast region is extracted from the infrared images using the connected component labeling method
  • The infrared images were aligned using a registration method
  • The blood vessels were segmented using morphological operators
  • For each vascular network, the branching points were exploited as thermal minutia points
  • The branching points were fed into a matching algorithm to classify breast regions into normal or abnormal, achieving a sensitivity of 86% and a specificity of 61%
References:
Mohamed Abdel-Nasser, Antonio Moreno, Domenec Puig (2019). ‘Breast Cancer Detection in Thermal Infrared Images Using Representation Learning and Texture Analysis Methods’, Electronics 2019, 8(1), 100
zaf3r
December 8, 2020
Artificial Intelligence As A Diagnostic Tool In Breast Cancer Thermography
December 8, 2020

One of the most common diseases that play a leading role in the death of women is breast cancer which is very difficult for countries’ healthcare system to treat, specifically in its advanced stages.

In the past, the temperature of human body was used as a health diagnostic tool. Warm blood flows in human body that produces heat. Respective changes in the temperature of the inner part of human body can be regarded as probable illnesses. Since 17th century thermometers were used as a tool to observe the temperature of the body. This procedure is known as Thermogulation. Scientists such as George Martin and Carl Wundelich stated that temperature of the body is a scientific criteria for diagnosing diseases. The normal body temperature is between 36.3 C to 37.5 C and any degrees out of this range is viewed as a symptom of diseases. In 1800, a new world appeared in the field of Thermography, infrared light was discovered by William Herschel and his son John Herschel recorded the first thermal images. Hardy in 1934 proposed that: “Human skin can be considered as a black body radiator”. He studied diagnostic tools in clinical science using infrared Thermography observations.


Thermography in clinical science

Although thermal imaging is not definite and surroundings can affect its results, but by using thermal images irregular thermal patterns can be easily recognized. Reasons why thermal imaging is wide-accepted among the medical community is listed below:

  • Thermal imaging is non-contact and non-invasive
  • The method can be used from far way
  • It’s possible to simultaneously monitor a large area of the population
  • Interpretation of thermogram’s colors is easy and fast.
  • This method only records natural radiation from the surface of the skin and there is no trace of harmful rays, so is suitable for long-term and repeating use.
  • Finally Thermography is a fast way to monitor and observe the dynamic changes in temperature.

Due to these merits, Thermography is an effective replaced diagnostic tool.

Thermography as a diagnostic tool for Breast Cancer

Thermography has many distinctive features. Some of them are listed in the following paragraph:

  • The ability for early diagnosis of cancer by detecting early signs of cancer, ten years earlier than mammography
  • Predicting the future state of the patient
  • Independence to the age of the patient and the density of breast tissue
  • Detecting symptoms of breast cancer 1 year earlier than mammography

In contrast, the lack of specialized knowledge to observe and poring over the results of Thermography is the vital feature that reduces its quality in comparison with other methods such as CBE, mammography and biopsy.

Artificial Intelligence in Breast Cancer Thermography

In 1960s, there was a strong tendency for replacing computers with physicians. However, at that time computers were not developed yet and modern digital images didn’t exist. These were the problems that caused the computer’s failure for detecting the abnormalities. In 1980s, despite of the failure in the 1960s, scientists used this approach to assist physicians in order to identify the abnormal areas and also provide a second opinion beside doctor’s detection. The approach is called Computer Assisted Diagnosis (CAD) and it is well-accepted all around the World. This approach (CAD) didn’t attempt to replace physicians with computers but it helped them to reach a more reliable way of diagnosis. From 1977 to 2015, several outstanding CAD systems in Thermography have been made. Even in 2002, with images taken from the camera of the second generation and the use of recurrent neural networks, the percentage of accuracy was the biggest challenge. In recent years, due to developments in image processing techniques, Sensitivity and Specificity in Thermography has been able to achieve more than other methods such as mammography. With production and advancement of neural networks and also introducing systems based on fuzzy logic and as well as the high quality of the Thermograms as a result of the second generation of cameras, Thermography systems (CAD) draw attention of many researchers.

Restrictions of Thermography as a diagnostic tool

There are some restrictions that restrict the ability of Thermography in diagnosis of abnormal states of breast tissue. Since this method is a thermal imaging of skin’s surface, it cannot detect a region or tumor. The interpretation of Thermography images depends on the identifying regions with high temperature, low metabolic function, or cold tumor, which is very challenging. According to a study about function of Thermography in 2003, it was found that all of the false-negative results of Thermography have been related on tumors on micro size; Which suggests that Thermography is not as accurate as mammography in detecting these abnormal states.

References:

Ahmad Ghafarpour1, Iman Zare1, Hossein Ghayoumi Zadeh2*, Javad Haddadnia3, Farinaz Joneidi Shariat Zadeh4, Zahra Eyvazi Zadeh4, Sogol Kianersi4, Sogol Masoumzadeh4 and Shirin Nour (2016). ‘A review of the dedicated studies to breast cancer diagnosis by thermal imaging in the fields of medical and artificial intelligence sciences’, Biomedical Research (2016) Volume 27, Issue 2
This website uses cookies to improve your experience. Cookie Policy